
[ad_1]
The Bitcoin trend of parabolic gains could see the top-ranked cryptocurrency set a new all-time high (ATH) before the end of 2018 or in early 2019. BTC is currently hovering between $6,000 and $7,000 with its highest third quarter price of $8,400 set in early July 2018.
Logarithmic Bitcoin Price Growth
The anthem for many BTC critics is its volatility. Bitcoin bashers do not relent in pointing out that the cryptocurrency experiences sharp price declines. While such assertions are correct, they miss the far bigger picture of how BTC behaves over time.
During its existence so far, BTC has experienced many massive price declines. However, Bitcoin has always ended each fall at a price level significantly higher than its value at the onset of the preceding price rally.
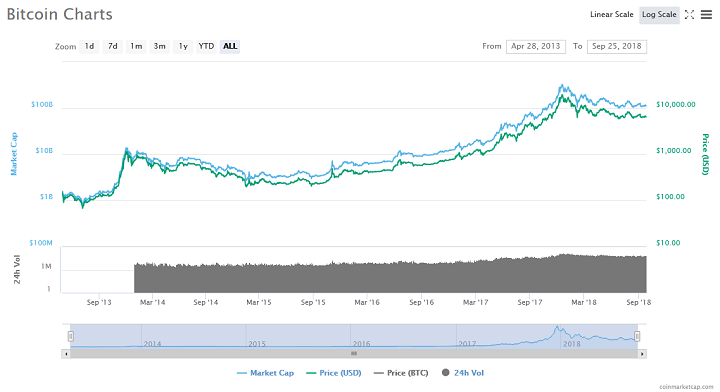
Simply put, Bitcoin exhibits consistent parabolic gains which means that it is a logarithmic asset. Thus, viewing the linear chart below, BTC appears to be in sharp decline since its mid-December 2018 ATH.
However, on the next chart below it is evident that BTC’s value has consistently risen on a yearly basis. Even after a price crash, BTC maintains a healthy variance when compared to its price before the start of the rally.
A Little Bit of History
Earlier in the year, Clem Chambers of ADVFN likened Bitcoin’s logarithmic growth to that of Warren Buffett’s investment portfolio. According to Chambers, the BTC price advances by 26 percent every period. Thus, Chambers predicted that Bitcoin could go from $20,000 into the realms of Draper and McAfee who have forecasted BTC prices ranging from $250k to $1 million.
Going by history, during BTC’s first bubble phase, it rose from $0.95 to $32 before suffering a 90 percent to settle at $2. In 2013, a similar trend occurred. BTC moved from $100 to $1,200 before a significant pullback brought the price to hover between $200 and $300.
Last year, BTC began the year under $1,000 and soared to nearly $20,000. After a 60 percent pullback, it has remained somewhat steady in the mid-$6,000 region.
The Bacteria Analogy
Earlier in the year, social scientist, Prateek Goorha likened Bitcoin’s price movement to the growth phase of a bacteria in a Medium post titled: The Parabolic Supertrend in Bitcoin — An assessment. According to Goorha, every Bitcoin price rally has emerged over a period characterized by three stages.
The first phase – “stasis,” sees the market coming to grips with the status quo established from the previous decline. The stage is characterized by sideways growth and a succession of short squeezes followed by mini declines.
Since the establishment of the $6,000 price bottom in February 2018, BTC has experienced four other mini price drops. Interspaced between these slumps have been periods of sudden but short-lived price growths (short squeezes).
The second phase – “exponential growth,” sees BTC rising sharply to set a new ATH. Like bacteria, the market appears to be doubling with the bulls firmly in control. Last period, the bull run coincided with the introduction of BTC futures trading.
The final phase – “decline,” sees BTC experiencing a massive pullback, usually above 70 percent. However, the top-ranked cryptocurrency always manages to bottom out higher than it was at the start of the previous rally.
If this pattern holds true, then BTC should be set for another eye-catching price run, maybe even into the six-digit realm.
Image courtesy of Coinmarketcap.

loading…
[ad_2]
Source link