[ad_1]
Latest Ethereum News
In a world defined by contracts and clauses, smart contracting platforms are a welcomed addition. But with dropping prices, projects that raised funds from Ethereum, for example, are struggling. The list of Dead Coins keeps growing every day and it is understandable.
ETH prices are down 80 percent from 2017 peaks and poised to loss more thanks to their coupling with BTC—the contagion effect, and the simple fact that blockchain projects still have their ETH holdings intact. Should they be forced to liquidate in a cash crunch then we expect prices to capitulate further towards the $100 or even the $50 mark further disillusioning the market.
Thing is, previous assessment by Jeremy Rubin the CTO of Stellar Foundation found that if projects running on the Ethereum network decide to settle their fees in ERC tokens and not in ETH then it would drop to zero in an economic abstraction case. Vitalik didn’t refute and somehow agreed but said that for projects to coordinate and pull off such a stunt would be hard if not impossible.
Already replied.https://t.co/D6c5jwGs4e
— Vitalik Non-giver of Ether (@VitalikButerin) September 3, 2018
That is apart from the SEC cracking down on exchanges, arresting ICO founders and forcing them to pay hefty charges for creating a marketplace for tokens classified as securities. Though the first obstacle is an abstraction, the second is a possibility that can immediately suppress expansion of ETH prices with SEC throttling network accessibility.
ETH/USD Price Analysis
With a market cap of around $14.2 billion, ETH is a tad-bit stable though there is a bear cloud hovering on this pair. ETH/USD is up four percent in the last day but down 33 percent in the last week. This underlines the dominance of sellers and XRP as the second most valuable coin in the space. Needless to say, weak fundamentals and unfavorable candlestick arrangement could further widen the gap and even pave way for XLM/ETH flip.
Trend: Bearish
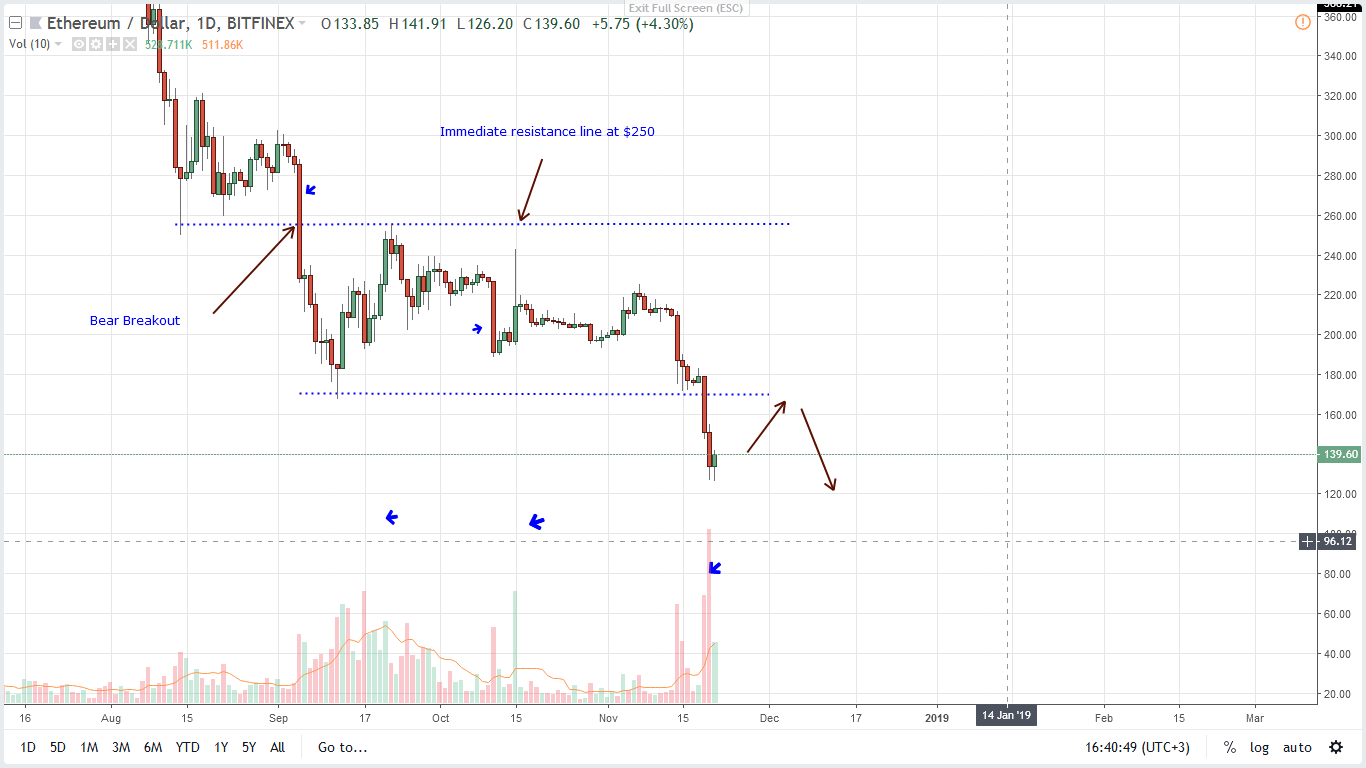
Like all markets, ETH/USD is bearish. A simple trendline connecting recent highs confirms this. Combine this with sliding market cap and the overview can’t be clearer.
Volumes: Bearish, increasing
In the last four months, there are three important bars that confirm the bear breakout pattern set rolling by early August 2018 meltdown.
Sep 5 bear bar breaking below $250 previous support now resistance with 594k against 207k average volumes and Nov 14 bear bar piercing through the main support line at $170 with 931k against 324k average volumes.
Notice that as prices print lower, volumes keep increasing. This can either mean bears are picking up momentum or we are nearing bottoms. The latter is most likely true now that prices are down +75 percent from 2017 peaks and this is the 11th month of relentless sell pressure.
Candlestick Formation: Bear Breakout
After two months of ranging, ETH/USD did break below $160—a main support line as highlighted in our last trade plan. Now, though we remain upbeat expecting prices to edge higher and even test $170 in days to come, we shall retain a bearish preview as long as prices are trending below $170. Unless otherwise, sellers should zoom out and fine-tune their entries in lower time frames selling on every high below $170.
Conclusion
Even as ETH find reprieve, it’s clear that prices are under immense bear pressure as price action trend within a bear breakout pattern. Unless otherwise there are strong surges above $170, we shall trade as aforementioned, fine-tuning entries in the one-hour chart with first targets at $100.
All Charts Courtesy of Trading View
This is not Investment Advice. Do your own Research.
http://platform.twitter.com/widgets.js
[ad_2]
Source link


