[ad_1]
The bitcoin price on Monday showed no significant movements after posting an impressive rally early Friday. That doesn’t mean the flagship cryptocurrency’s rally is over, however.
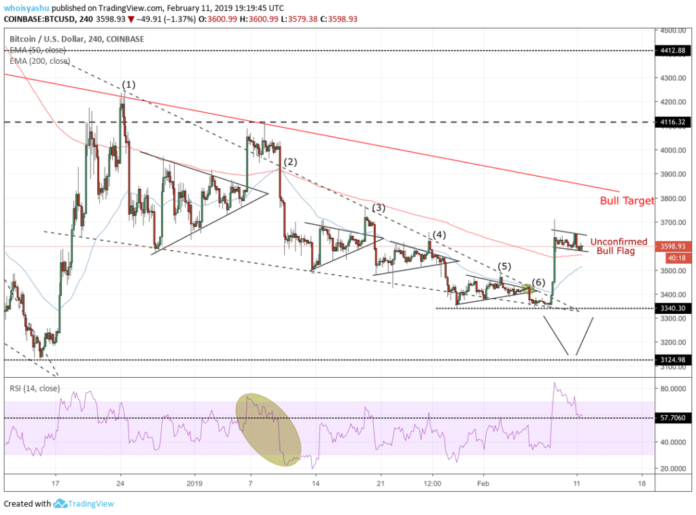
As of the time of writing, the bitcoin-to-dollar exchange rate (BTC/USD) was trading at $3,598, up 0.05 percent since the Asian session open. The pair consolidated sideways ahead of the US trading hours inside a narrow – and a rather weak – downward channel. From a broader perspective, this channel gave a hint of a near-term bull flag formation.
Bitcoin’s Bull Flag – and What it Means
Technically, a bull flag formation is a signal for an extended upside action. It is represented by a period of consolidation, similar to what we are witnessing in the Coinbase chart above. However, as it is the first of many potential bull flags, its longevity can be questioned. That being said, if price manages to attempt a breakout to the upside, coupled with an increase in trading volume, then the bull flag would be confirmed, and we’ll see bitcoin retesting the $3,800-bull target – the near-term descending trendline depicted in red.
Conversely, if we break down instead, then bitcoin could first seek support at the 200-period moving average in red. If it’s broken to the downside, then the 50-period moving average should promise to hold the selling action.
An overlong stay inside the bull flag would increase the probability of a breakdown action. It is evident in the past movements of our 4H RSI momentum indicator. In the chart above, one can notice an eclipse engulfing the RSI action between January 7 and January 14. We can see the momentum indicator entering its overbought sentiment area above 60 and then correcting lower. Then, it is finding support above 57, followed by an eventual breakdown towards its oversold sentiment region.
In the current momentum action, we can see the RSI testing 57.7 for support. According to our theory, a break below this level could excite bears. At the same time, if RSI continues to trend above 57.7, then it could confirm the next rally towards $3,800 – as mentioned above.
Bitcoin Price Intraday Analysis
With bitcoin trending inside a narrow channel, there are other profitable opportunities at hand for day traders. A bounce from flag support would have us enter a long position towards flag resistance. At the same time, a stop loss order 1-pip below the entry position would define our risk management.
Conversely, a pullback action from flag resistance would allow us to open a short position towards flag support. Meanwhile, we will maintain a stop loss order 1-pip above the entry position to minimize our losses if the bias reverses.
Regarding our breakout strategy, a break above flag resistance would have us target $3,800 as our upside target. However, in case the bearish action takes over, we would wait for the bitcoin price to break below flag support. If it does, then we will enter a short position towards the 200-period moving average at that time.
Featured Image from Shutterstock. Price Charts from TradingView.
[ad_2]
Source link

