[ad_1]
Latest Litecoin News
Charlie Lee, as controversial as critics think he is, is an ardent supporter of Litecoin and Bitcoin. He might have liquidated his stash at the peaks of late 2017—unheard of from a project founder, “interrupting” and even warning investors that asset prices were overextended and may crash.
Ok, sorry to spoil the party, but I need to reign in the excitement a bit…
Buying LTC is extremely risky. I expect us to have a multi-year bear market like the one we just had where LTC dropped 90% in value ($48 to $4). So if you can’t handle LTC dropping to $20, don’t buy! 😀
— Charlie Lee [LTC⚡] (@SatoshiLite) December 11, 2017
Then, he projected that Litecoin may even drop to $20—from around $400. Charlie Lee sold his at a huge profit to “avoid conflict of interest.”
Read: (Crazy?) Crypto Prediction: Bitcoin (BTC) To Fall To $1,100, Litecoin to $6
All the same, his advocacy for Litecoin is tireless and persistent. In an interview with CNBC’s Fast Money, days before the Litecoin Summit, he said his ultimate goal was to see people focus more on technology, adoption and scalability despite depressed asset prices:
“I would like for people to focus on the technology, adoption, merchant adoption and also how to scale. So, things like the Lightning network, sidechains, and things that would help Bitcoin and Litecoin scale”
With Litecoin listed in as many exchanges as possible, merchant adoption picking up and Gemini marketing all over New York, the coin is now getting the much-needed limelight.
Also Read: Tron (TRX) Top Performing Cryptocurrency So Far This Year
Then again, they have done their own marketing and are sponsoring the UFC. As such, we expect volumes to pick up and with that, prices.
LTC/USD Price Analysis
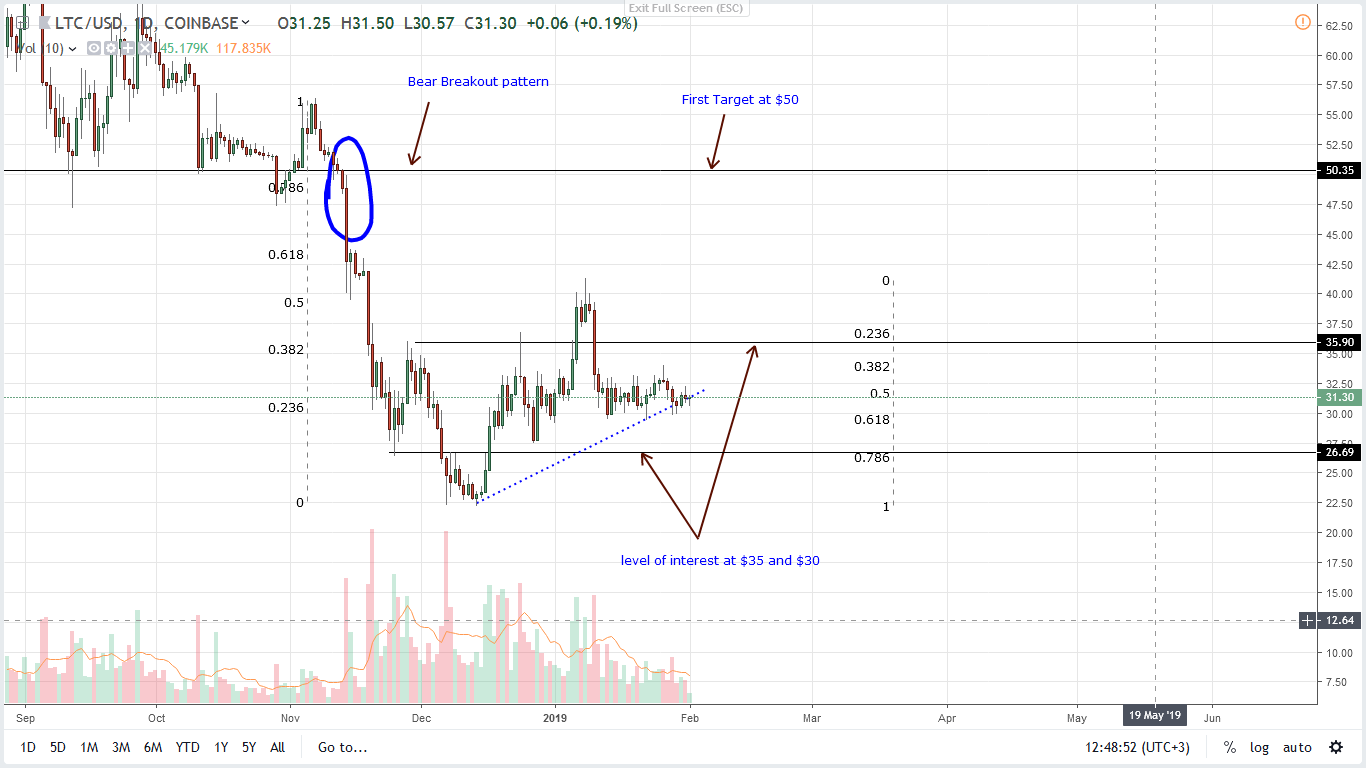
Despite TRX cross-hairs, LTC is still $200 million ahead. We expect this gap to extend in coming days partly because of the coins resilience and the strength of the main support line. From the chart, we notice that prices are trending above a positive trending support trend line, shoring prices above $30 as LTC/USD range horizontally after Jan 10 meltdown. Nonetheless, our previous trade plan is valid and as long as supports remain at $30, bulls have a chance.

Trend and Candlestick Arrangement: short-term bullish, breakout pattern
From a top down approach, sellers are in control. And why not, prices are trending below previous supports now resistance at $50. In a bear breakout pattern, it is likely that LTC/USD is temporarily bullish within a retest phase of a larger bear breakout pattern.
However, before we conclude, it is imperative for prices to surge above $35 and even Jan 2019 highs of $40 as aggressive traders initiate longs on every drop in lower time frames.
Such moves will be invalidating the bear breakout move of Jan 10 and bringing to life the double bar bull reversal pattern of Dec 27-28 and the Morning Star pattern of mid-Dec 2018.
Volumes: Bearish
To reiterate, LTC is technically bearish from a top down approach. And this is from the charts. Note that a stand-out bar in recent months is Dec 07, 2018 bear bar with 743k versus 307k.
In the last month or so, attention has shifted to Jan 10—468k versus 262k. All these bars are bearish. Therefore, for bulls to be in charge, we must see similar surges either driving prices above $35 or $40.
It won’t matter. The bottom line is that volumes should exceed on the lower limit today’s averages of 130k or 468k of Jan 10.
All charts courtesy of Trading View
This is not investment advice. Do your research.
[ad_2]
Source link