[ad_1]
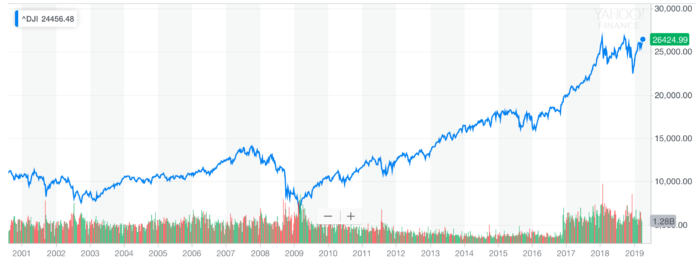
The Dow Jones Industrial Average is within touching distance of an all-time high after climbing 13 percent alone in 2019. It marks one of the best first quarters on record for the Dow, but traders should be cautious as several warning lights flash red.
Namely, China’s aggressive gold hoarding, the recent yield inversion, and the potential of a disappointing trade deal between China and the US. Let’s take a closer look.
Warning #1: China’s Gold Hoarding
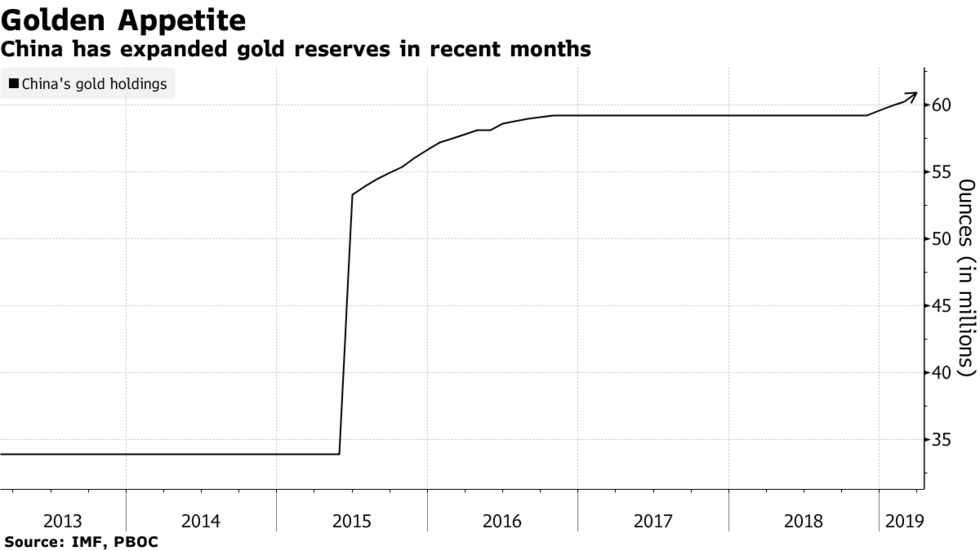
China is stockpiling gold at a phenomenal rate, bumping up its reserves for the fourth straight month. China added 11.2 tons of gold in March, totalling 43 tons since November 2018.
China isn’t the only country hoarding gold. In 2018, central banks bought more gold than any year since 1967, with Russia stockpiling an extra 274 tons in one year.
There are many reasons why central banks store gold (for example, to use as collateral or reduce reliance on the dollar). But a huge reason for owning gold is its role as a safe haven – to protect against market downturns. It seems the world’s largest economies are bracing for an imminent crisis in global markets.
Warning #2: A Potentially Disappointing Trade Deal
Part of the Dow’s phenomenal first-quarter surge is optimism surrounding Trump’s trade deal with China. Traders are arguably pricing in the expectation of strong deal – one in which China’s concedes on issues of technology transfer and intellectual property.
But anything less, and the Dow could see a huge sell-off. As one investment officer, Peter Boockvar, told CNBC:
“It’s sell the news… The stock market is betting we’ll get a quick reversal to the upside in economic growth on the trade deal.”
Boockvar and others suggest the Dow is priced to perfection on trade deal optimism. Any disappointment in the deal will result in a sell moment.
“Dow jumps 150 points as Street awaits trade deal news.”
The 20% rally off the since Dec-18 is largely due to this exact headline. The sell the news event is going to be massive. This is going to fade. https://t.co/FG7XwXD2kU
— Ahmad Khokhar (@khokhar_ahmad) April 4, 2019
Warning #3: The Inverted Yield Curve
On March 22nd, traders were gripped with panic over the inverted yield curve. It’s an important metric because it predicted the last two major recessions.
What exactly is the inverted yield curve? In simple terms, it means long-term yields on US Treasury notes fall below short-term yields. It indicates that traders don’t have much optimism for long-term assets and is often seen as a precursor to a market reversal.
Highlight: The inverted yield curve has “been a great indicator of a recession coming,” says @EatonVance’s Nisha Patel. “But the timing of this can vary greatly.” Also talks about US-China trade tensions and the Fed with @MatsonMoney’s @MarkMatson and @AkikoFujita. Full segment: pic.twitter.com/elXJ9obdQb
— Yahoo Finance (@YahooFinance) April 3, 2019
It happened in 2000, shortly before the 2001 crash. The yield also inverted in 2007, and we all know what came next. While it doesn’t immediately mean a crash or recession is imminent, it’s definitely a warning sign in regard to investor sentiment.
Dow Teases Record Highs
Despite the numerous warning signs, the Dow is approaching its record closing high of 26,828, hit on 3rd October 2018.
A handful of technical indicators suggest the momentum could push the Dow beyond this all-time high and right through to the psychological barrier of 3,000. However, traders should keep the warning lights firmly in mind.
[ad_2]
Source link

