[ad_1]
Fundstrat’s Tom Lee had predicted Bitcoin price to touch the $25,000-mark by the end of 2018. The November crash prompted the crypto bull to lower his prediction to $15,000. However, against the projections, the digital currency closed the year just shy of $3,800, according to CoinMarketcap.com.
The new year also did not bring much relief to the bitcoin and the rest of the cryptocurrency market. The industry entered its most extended bear cycles in February 2019 and, according to Fundstrat, it is heading lower shortly. The bullish-turned-bearish market research firm said in an email to Bloomberg that bitcoin could now fall below its current-bottom level near $3,100.
Fundstrat Set Downside Target towards $2,270
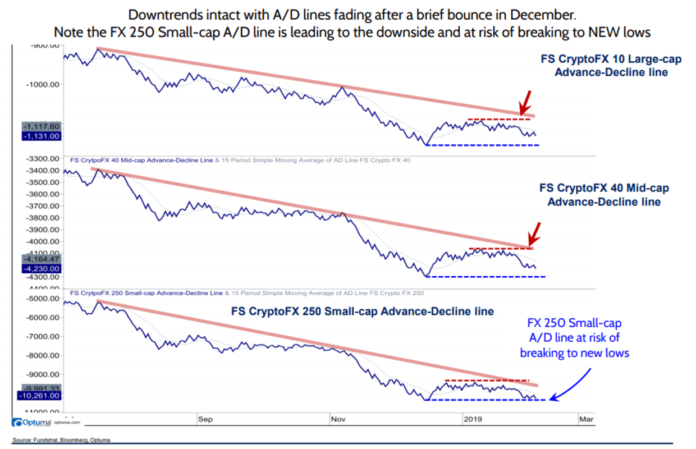
Advance/Decline line (A/D) plots the difference between the number of advancing and declining assets daily. | Source: Fundstrat, Bloomberg
Fundstrat posted the price action of three of its cryptocurrency indexes: FS CryptoFX 10, FS CryptoFX 40, and FS CryptoFX 250. The numbers 10, 40, and 250 reflects the ranking of cryptocurrencies in the index. For instance, CryptoFX 10 tracks price data of top ten cryptocurrencies by market capitalization, which include Bitcoin, Ether, and XRP. Similarly, CryptoFX 40 tracks the top 11 to 40 digital currencies. And so on.
Meanwhile, the Advance/Decline line is a technical indicator which plots the difference between the number of rising and falling assets every 24-hours. A rising line indicates a bullish trend, while a falling line reflects a bearish trend.
Robert Sluymer, the market strategist with Fundstrat Global Advisors, found that CryptoFX 250, an index comprising of smaller cap coins, were at the maximum risk. He told Bloomberg:
“The price structure for most cryptocurrencies remains weak and appears vulnerable to a pending breakdown to lower lows. Fundstrat’s advance/decline indicator is at risk of breaking to new lows.”
While the CryptoFX 250 index tracks the performance of the top 51 to 300 cryptocurrencies by market capitalization, its negative performance plagued the market sentiment of advanced indexes as well. The CryptoFX 40 index, for instance, was heading towards its previous lows, expecting a breakdown action. Similarly, the CryptoFX 10 index, which includes bitcoin, was also hinting a double bottom scenario soon.
“A break below the fourth-quarter lows at $3,100 would imply a decline to $2,270, while a move above $4,200 is needed to signal Bitcoin is beginning to improve,” Sluymer said about bitcoin.
CCN’s Analysis
In our bitcoin analysis published yesterday, we have found that the digital currency is resilient to bearish pressure near the support trendline of the current falling wedge formation. Bitcoin had attempted to break below the said floor on five separate occasions recently. In its sixth attempt, the digital currency is also nearing to the apex of the falling wedge, which means it could attempt a breakout action soon.
However, an extended downside momentum could lead Bitcoin to form a double bottom scenario at $3,310, which is also a bullish reversal pattern.
Click here for a real-time bitcoin price chart.
Featured Image from Shutterstock. Price Charts from TradingView.
[ad_2]
Source link

