
[ad_1]
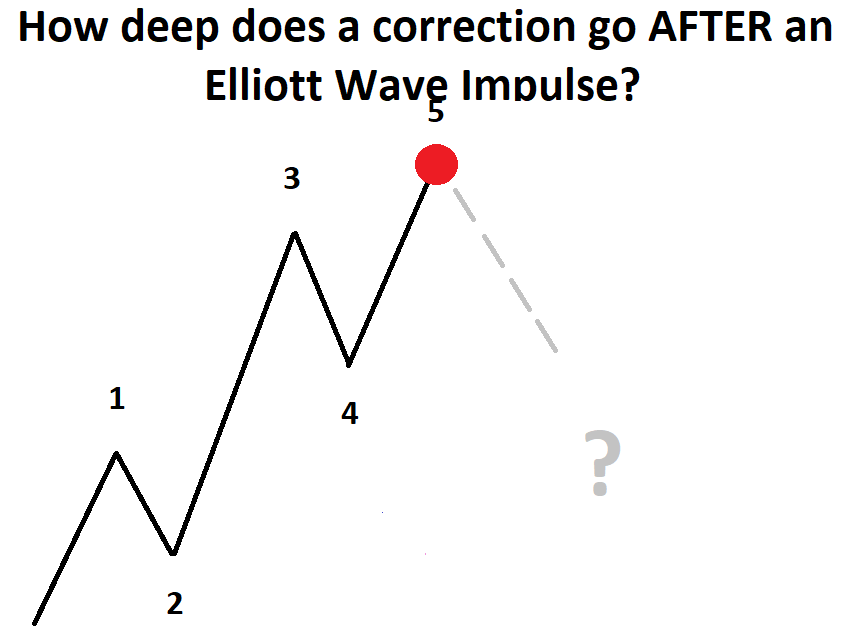
The Elliott wave impulse pattern is a foundational pattern of Elliott Wave Theory. Ralph Nelson Elliott discovered back in the 1930s that the market moved in waves of five and three legs. These five and three wave patterns make up larger patterns that can be used to determine how mature the current trend is and where likely levels of retracement may take place. Today, we will focus on likely levels of retracement after an Elliott wave impulse pattern completes.
Learn more about the foundational Elliott wave patterns in the beginner and advanced Elliott wave guides.
Elliott wave impulse patterns appear only in certain spots of the Elliott wave sequence. Therefore, it is important to know not only where an impulse wave may form, but also to know where the impulse wave may NOT be found. Knowing these positions can help you anticipate the depth of the subsequent correction giving you guidance on how aggressive to pursue the anticipated wave.
where Elliott wave impulse patterns are found
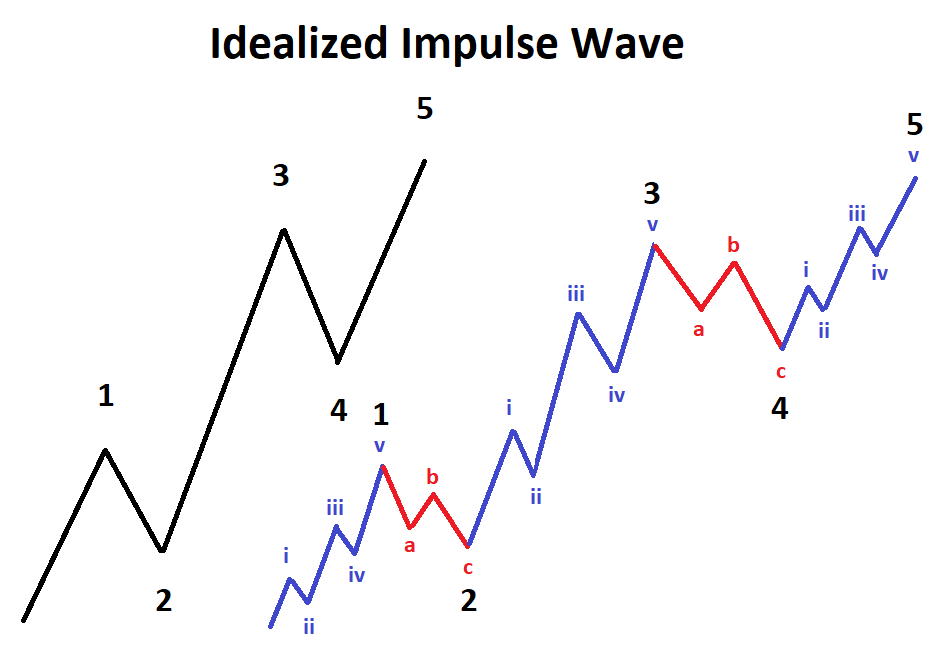
Since the market is fractal, let’s break down the Elliott wave impulse so that two degrees of trend are visible. On the image below, you will find 21 sub-wave labels (blue and red) that make up the larger five wave impulse (black).
Of all these waves, waves ii, iv, b, 2, 4 are NOT impulse waves. By process of elimination, an impulse wave can be found in these positions: i, iii, v, a, c, 1, 3, 5.
Impulse waves might make up a portion of a corrective wave, but not ALL of the corrective wave. For example, it could be wave a of 2. However, an impulse will not be ALL of wave 2 because only 3 waves are present. Out of these 21 sub-waves in an impulse, only wave iii and wave 3 MUST BE impulse waves themselves.
Notice that after each impulse wave, a correction of that impulse takes place. In some instances, the correction is shallow, the correction is deep, or the correction is led off with another impulse wave. Let’s investigate more closely the eight positions in the Elliott wave sequence where an impulse wave can be found and discuss what typically happens next.
Impulse wave scenarios and what typically follows
- Wave i – according to Elliott’s rules, wave ii that follows must be a partial retracement of less than 100% the length of wave i. Retracements generally fall within 38-78% the distance of wave i. Wave .4 of i (not shown) typically provides a bounce…either a mild bounce or it holds all of the correction.
- Wave iii – according to Elliott’s rules, the wave iv that follows cannot overlap the price of wave i. Initially, that gives you a maximum level to expect for the depth of the retracement and therefore, is a place to hold a stop loss in long positions. Many times, wave iv corrects about 38% the length of wave iii.
- Wave v– wave v is the final wave of that initial sequence. Therefore, a deeper correction is likely to take hold. Many times, once a fifth wave is in place, expect to see an eventual correction of the entire fifth wave. Look for an initial target of the previous wave iv and possibly lower levels. In the illustration above, notice how both of the red a-b-c waves corrects all of wave v as the market trades back to wave iv?
- Wave a – if this wave is an impulse, then that means we are looking at a zigzag or complex correction. If wave a is an impulse, then your high of wave v likely holds for the near term. Many times, wave a drops to the previous fourth wave (wave iv). This wave typically isn’t a real deep correction by itself and the subsequent rally is relatively brief.
- Wave c-if this wave is an impulse, then we are looking at the c wave of a flat or zigzag. Many times, wave c will be equal or have Fibonacci proportions to the length of wave a. When projecting this price, many times it will reach and possibly surpass the depths of wave iv. Once wave c is over, it is highly probable the next move is a wave that overcomes the entire a-b-c sequence. Using the illustration above, a strong move to the upside ensues.
- Wave 1 – since the market is fractal, the guidelines for depth of correction is going to be the same relative to wave i. Look for a 38-78% retracement of wave 1, but less than 100% retracement. The previous wave iv typically acts like a magnet and is either part or all of the correction.
- Wave 3 – as the market is fractal, the depth of the correction in wave 4 will mirror what was said for wave iii above. Wave 4 cannot overlap the territory of wave 1. Wave 4 likely retraces about 38% the length of wave 3. Look for the previous fourth wave (wave iv) to be an initial target.
- Wave 5 – as the market is fractal, the depth of the correction following wave 5 will mirror what was said in wave v above. Wave 5 is the final wave of the whole sequence, a terminal wave. Therefore, a deeper correction is likely to take hold. Many times, once a fifth wave is in place, expect to see an eventual correction of the entire fifth wave. Look for an initial target of the previous wave 4 and possibly lower levels. Another tool you can use is Elliott wave channeling where you draw a trend line connecting the end of wave 2 and wave 4. If this trend line breaks, it is an additional clue that wave 5 is likely over and a deep correction is taking hold.
Subsequent wave after Elliott wave impulse summary table
|
Impulse Wave |
Next Wave |
Typical Retracement of Impulse Wave |
|
i |
ii |
38-78% of ‘i’ |
|
iii |
iv |
38% of ‘iii’ |
|
v |
‘a’ of larger correction |
<100% of ‘v’ |
|
a |
b |
38-78% of ‘a’ |
|
c |
‘i’ of larger motive wave |
>100% of ‘c’ |
|
1 |
2 |
38-78% of ‘1’ |
|
3 |
4 |
38% of ‘3’ |
|
5 |
‘A’ of larger correction |
>100% of ‘5’ |
As you can see above, the location of the final impulse wave can have a dramatic effect on what is expected to happen on the next move. Sometimes, the retracements are relatively shallow retracing only 38%. Sometime, the corrections can be large so as to fully retrace the previous impulse wave. There is one thing in common between all scenarios in that a minimum retracement to the previous fourth wave typically occurs. Bear in mind that if you are analyzing a sequence that is terminating at a longer term and higher degree, then these corrections can be quite large and damaging.
how do I know which Elliott wave scenario(s) to follow?
Elliott wave is deductive by nature. Anything is possible until we can eliminate those scenarios that break one or more of Elliott’s rules. From there, we assess the probability of a scenario based on the look and feel of the wave picture based on numerous guidelines. Therefore, if you believe an impulse wave is nearing its final stages, zoom out to see what larger pattern that impulse wave is constructing. Based on what you identify through that deductive process, you can focus on a small number of scenarios above. Therefore, if you can identify and count the completed impulse wave, you can begin to identify minimum targets for a corrective move. A novice Elliott wave technician can further eliminate those scenarios above that do not fit within the larger picture.
—Written by Jeremy Wagner, CEWA-M
Jeremy is a Certified Elliott Wave Analyst with a Master’s designation. You can follow his Elliott wave analysis via regularly published Elliott wave articles and through his US Opening Bell webinar.
Communicate with Jeremy through the comments section below.
Follow Jeremy on twitter @JWagnerFXTrader .
Learn more about how Jeremy got started into Elliott wave from his podcast interview on Trading Global Markets Decoded. You can access through:
Stitcher – https://www.stitcher.com/podcast/trading-global-markets-decoded-with-dailyfx/e/57431393
itunes – https://itunes.apple.com/us/podcast/trading-global-markets-decoded/id1440995971